GE Communicator
Advanced Setup, Logging, Visualization, and Analysis Software for EPM Meters

GE Communicator is an easy-to-use software application to setup and maintain EPM meters as well as view data and generate reports to support analysis. It provides advanced visualization functionality including graphing/trending values; viewing waveforms/log records; and generating customizable reports. Furthermore, with MeterManager, meters can be grouped together, meter diagnostics and status can be determined, and data can be automatically retrieved at intervals for report generation. Using database structures, the stored metering information is available for integration into third-party software packages for further use or actions. GE Communicator connects to meters locally or remotely using the meters’ supported communications protocol via a USB, Serial, Ethernet, or Modem communications connection.
There are two versions of GE Communicator available – GE Communicator (which is downloadable and included with a GE EPM meter purchase and a GE Communicator Professional (Licensed) version which requires a license key to activate.
GE Communicator allows users to configure meters, send settings files, download data logs manually from meter memory, and view data charts/graphs and basic waveforms. The GE Communicator Professional (Licensed) version adds additional features including automatic/scheduled retrieval of meter data logs; creation/email of spreadsheet reports; and additional PQDIF, COMTRADE, and HHF file generation.
GE Communicator
Advanced Setup, Logging, Visualization, and Analysis Software for EPM Meters
GE Communicator is an easy-to-use software application to setup and maintain EPM meters as well as view data and generate reports to support analysis. It provides advanced visualization functionality including graphing/trending values; viewing waveforms/log records; and generating customizable reports. Furthermore, with MeterManager, meters can be grouped together, meter diagnostics and status can be determined, and data can be automatically retrieved at intervals for report generation. Using database structures, the stored metering information is available for integration into third-party software packages for further use or actions. GE Communicator connects to meters locally or remotely using the meters’ supported communications protocol via a USB, Serial, Ethernet, or Modem communications connection.
There are two versions of GE Communicator available – GE Communicator (which is downloadable and included with a GE EPM meter purchase and a GE Communicator Professional (Licensed) version which requires a license key to activate.
GE Communicator allows users to configure meters, send settings files, download data logs manually from meter memory, and view data charts/graphs and basic waveforms. The GE Communicator Professional (Licensed) version adds additional features including automatic/scheduled retrieval of meter data logs; creation/email of spreadsheet reports; and additional PQDIF, COMTRADE, and HHF file generation.
Key Benefits
- User-friendly software interface for easy setup and commissioning of EPM meters
- Simplified and accurate data collection and presentation of key, real-time collected meter information such as voltage, current, power and energy, time of use, power quality, harmonics, waveforms, alarm/limits, and I/O status
- Support for integration with other software packages with ODBC-compliant database structures
- Two versions – GE Communicator for setup and basic data visualization and GE Communicator (Licensed) for meter system setup, automated data retrieval, and advanced visualization and analysis
Applications
- View and compare multiple values, circuits, and waveforms from one or more events
- Easily zoom/pan, mark, and add annotations to waveform records for detailed analysis
- Baseline and monitor data for impact and performance reviews
| FEATURE | GE COMMUNICATOR | GE COMMUNICATOR PROFESSIONAL (LICENSED) |
|---|---|---|
| Setup and configure GE EPM meters | • | • |
| Database storage of collected information for SQL searches and data mining | • | • |
| View basic charts and graphs; basic power quality waveform viewer | • | • |
| Auto-collect data using MeterManager automation server tools | • | |
| Detect installation and quality of service issues | • | |
| Create and email spreadsheet reports automatically on a set schedule | • | |
| Generate PQDIF, COMTRADE, and HHF files | • | |
| Integration to GE Energy Aggregator – Energy dashboard/reporting | • |
View Real-Time Data
GE Communicator connects to EPM Meters to view real-time data remotely and safely. Examples of data that can be viewed include voltage, current, power, and energy; time of use and accumulations; power quality; harmonic magnitudes; real-time waveform scopes; alarms and limits; max. and min. for each parameter; and I/O device information.

View Waveform Data
View Logged Data
The Log Viewer provides charting and graphing using database-driven, normalized data from GE EPM Meters. The charts and graphs provide concise visualization to help interpret retrieved data support analysis.
Features include:
- Tabular data format to support spreadsheets
- Multi-pen charting and graphing
- View data by month, day, or year
- Plotted max. and min. values
- Zoom and pan of graphs
- Cut/paste functionality

Visualize/Trend Energy Data
Advanced Power Quality Visualization, Charting, and Graphing
GE Communicator supports advanced visualization of power quality information in various industry standard formats including a scatter graph, providing CBEMA plotting information. The CBEMA plot gives definition to the severity of events and their effect on equipment. For example, if multiple events fall outside the CBEMA tolerances, the monitored equipment may be damaged. Furthermore, visualizations such as 3D plots and histograms with frequency and severity of power quality events can also be shown.
- View ITIC, Semi F47, CBEMA, and other industry-standard graphs
- View time waveform events using millisecond resolution
- Sort data by fault type
- Compare information from circuits
- Review impact of changes to protective equipment
- Monitor and analyze performance metrics
- Conduct post/forensic analysis of events
- View cycle-by-cycle RMS trends

View CBEMA and Other Power Quality Indices
View Waveform Records
GE Communicator provides easy-to-use visualization of waveform data for fast and simple analysis. Various views illustrate stored information graphically such as phasors for easy troubleshooting, as well as waveforms of events caused by power quality problems, faults, transients, and other conditions.
Features include:
- View, zoom/pan, and compare multiple waveforms from one or more events
- Conduct harmonic analysis of waveform data using harmonic magnitudes, peak value, and RMS readings per cycle
- Add databased annotations to waveform records

Analyze Waveform Records
Meter Management System
GE’s MeterManager is available with the GE Communicator Professional (Licensed) version and provides a comprehensive meter management system, with report generation, and data collection for up to 1,200 Ethernet-connected meters.
Automated Status, Report Generation, and Export
GE MeterManager’s Report Exporter provides design of customized reports of meter data. Reports can be generated for one or more meters and can be set up for automatic report generation at specific intervals (e.g., hourly, multi-hourly, daily, weekly, or monthly). Report Exporter can also export reports via email and upload reports via FTP to a central location for viewing.
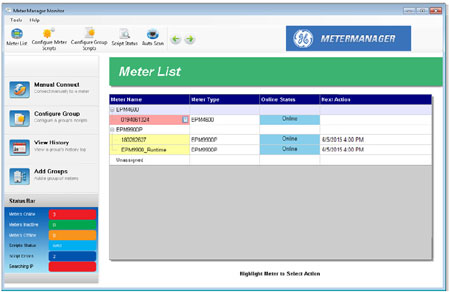
Group and see status of meters

Configure automatic reports
System Requirements
| System Requirements | |
|---|---|
| Supported Operating Systems |
|
| Memory |
|
| Storage |
|
| Other |
|
Recommended Products & services
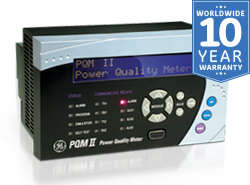
PQM II
The PQM II is an ideal choice when continuous monitoring of a three phase system is requir
View More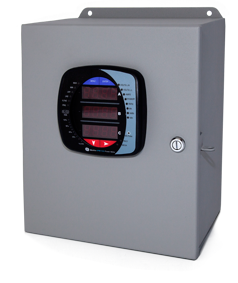
Meter Enclosures
Expanding existing switchgear or installing new metering capability can be challenging due
View More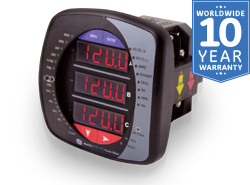
EPM 2200
Economical Power and Energy MeasurementThe Multilin™ EPM 2200 meter is an economical, mu
View More