EnerVista Viewpoint Monitoring
Easy to Use Monitoring and Data Recording Software
EnerVista Viewpoint Monitoring is an easy to setup and powerful data monitoring and recording software application that provides an overall, integrated view of an electrical system.
With minimal device communication configuration, it collects critical real-time and historical disturbance data to assist with analyzing past or impending power system events.
Key Benefits
- Easy start up and configuration saves time and cost by integrating devices using pre-programmed memory maps
- Automatically generated, user friendly monitoring screens provide remote equipment visibility
- Reduced integration time through automatic detection and configuration of UR devices
- Reduced fault analysis effort by centralizing critical fault data digitally
- Records and trends power equipment load levels for load analysis
- Remote viewing of Viewpoint Monitoring system using ViewNodes or Terminal Services in Microsoft Windows Server 2019/2022 (Remote access requires Microsoft Windows Server Remote Desktop Services (User or Device) purchased separately)
Key Features
- Monitor up to 1000 devices (20000 data points) or 5000 devices (65000 data points)
- User friendly drag-and-drop construction of single-line monitoring screens
- Pre-configured memory maps of GE Vernova’s Multilin™ devices
- Single-line monitoring and control
- Trending of up to 5000 power system data points with 1 minute resolution
- Communicate with third-party Modbus compliant field devices
- Plug-and-Play analysis of power system equipment
- Automatic collection of events and waveforms from GE Vernova’s Multilin devices
- Annunciator alarming with visual, audio and email notification
- Diagnose waveform fault data recorded in power system devices
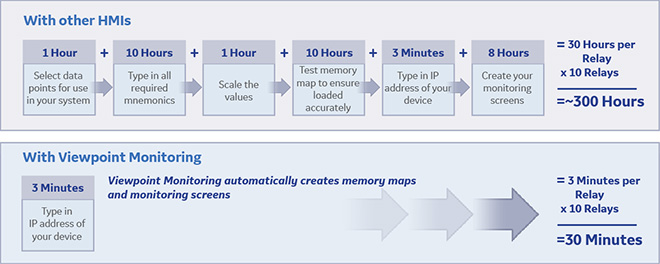
Viewpoint Monitoring Advantage
Viewpoint Monitoring Reduces Commissioning Effort Saving Time and Cost
The following is an example of connecting and communicating with a 869 Motor Protection Relay to monitor relay and motor data:
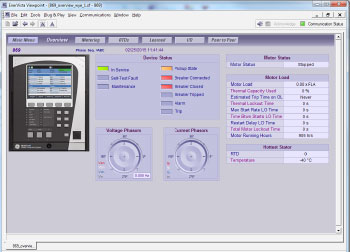 View motor status using digital inputs, analog inputs and RTD inputs.
Plug-and-Play Motor Monitoring
Use Viewpoint Monitoring to Monitor Motor Protection Equipment
Monitor critical information such as:
- Number of motor starts
- Learned motor starting current
- Motor running hours
- History of motor trips
- Electrical Signature Analysis (ESA)
- Motor temperature
Supported Devices:
|
|
|
|
|
|
|
|
|
|
|
|
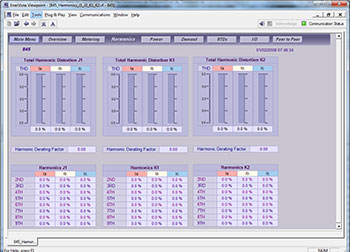 Monitor total harmonic content in each phase for all windings.
Plug-and-Play Transformer Monitoring
Use Viewpoint Monitoring to Monitor Transformer Protection Equipment
Monitor critical information such as:
- Transformer energization status
- Real time power quantities (amps, transformer loading, demand)
- Current harmonic analysis
- Accumulated loss of life
- Tap changer position
- Hottest transformer winding temperature
Supported Devices:
|
|
|
|
 Improve maintenance efficiency by analyzing trip operations.
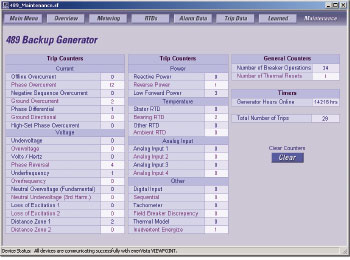
Plug-and-Play Generator Monitoring
Use Viewpoint Monitoring to Monitor Generator Protection Equipment
Monitor critical information such as:
- Generator loading
- Real time power quantities (amps, volts)
- Generator running hours
- Generator temperature
- Cause of trip data
- History of generator trips
Supported Devices:
|
|
|
|
 Easily monitor synchronism levels needed for reclosing of circuit breakers.
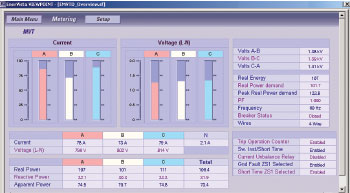
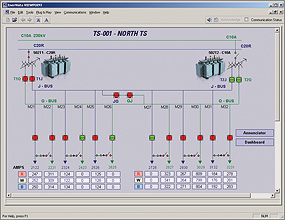
Plug-and-Play Feeder Monitoring
Use Viewpoint Monitoring to Monitor Feeder Protection Equipment
Monitor critical information such as:
- Breaker status
- Accumulated breaker arcing current
- Real time power quantities (amps, volts, demand, energy)
- Synchronism data
Supported Devices:
|
|
|
|
|
|
|
 Monitor breaker equipment with predefined screens.
Plug-and-Play Breaker Monitoring
Use Viewpoint Monitoring to Monitor Breaker Equipment
Monitor critical information such as:
- Breaker status
- Number of breaker trip operations
- Real time current, voltage and power levels
Supported Devices:
|
|
|
|
 Monitor the power quality status for critical devices.
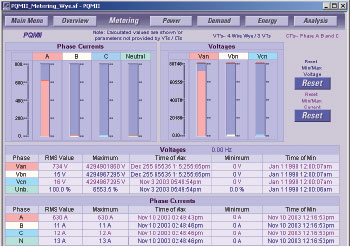
Plug-and-Play Power Quality Monitoring
Use Viewpoint Monitoring to Monitor Power Quality Equipment and Measure Usage
Monitor critical information such as:
- Power quality and equipment status
- Load unbalances using real time and maximum and minimum values
- Consumption and cost of energy using inputs from revenue meters
- Amount of total harmonic distortion on the power system
Supported Devices:
|
|
|
|
|
|
|
|
|
 Monitor the status of critical backup assets.
Plug-and-Play Backup Power Monitoring
Use Viewpoint Monitoring to Monitor Critical Backup Assets
Monitor critical information such as:
- Availability of normal and emergency power sources
- Status of power source connections
- Real time voltages and frequency
- Switch status, timer settings and control switch position
- Stored events and exerciser schedules
Supported Devices:
|
|
|
|
|
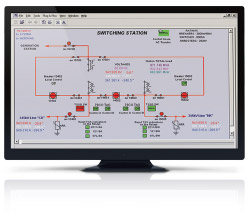
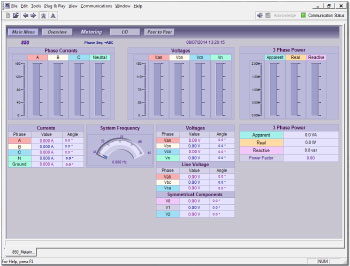
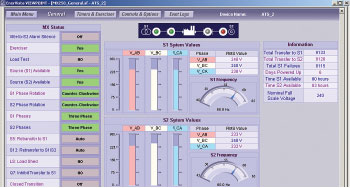
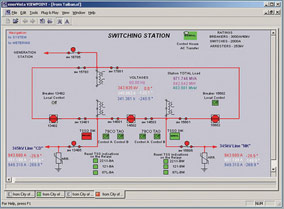
Single-Line Monitoring and Control
View the Power System Status on Customizable Single-Line Diagrams
Viewpoint Monitoring provides the tools to easily create customized single-line diagrams providing monitoring and control. This powerful tool will communicate with supported devices and put the facility's energy system at your fingertips from either a local or a remote location.
 Easily create customized screens to monitor the power system state
Easily Create Customized Single-Line Monitoring Screens
- Create single-line diagrams using user-friendly, drag-and-drop tools with standardized symbols and components representing power system assets (transformers, breakers, CT's and PT's)
- Import graphics to customize single-line diagrams and increase usability
- Display power system values and status with minimal configuration through preloaded memory maps
- Create customized or "virtual" monitoring points using the powerful Formula Editor
 Monitor the motors status and loading throughout the facility from a centralized location locally or remotely.
Monitor Power System Devices
- Provide a system-wide view of the power system on one single-line monitoring screen
- Analyze the magnitude of critical power quantities measured by devices
- Generate alarm warnings when measured values exceed configurable critical levels
- Create links to multiple monitoring screens to analyze power system equipment with greater detail
 Monitor the status of the entire power system and control components from one screen.
Control Power System Equipment
- Send commands to devices to control and change the status of power system equipment (breakers, switches, isolators)
- Enforces required two-step verification process to the operator sending the command
- Validates user's permissions by requiring passwords to be sent to protection relays or other devices before operation occurs
Annunciator Alarming
Receive Reliable Notification of System Alarms from Devices on the Network
Viewpoint Monitoring Annunciator Alarming actively monitors measured values and generates alarms. Alarms can be configured to be activated whenever a digital status changes state, or an analog value changes beyond any programmed threshold. Alarms can be delivered through multiple visual, audio, or e-mail notification channels. Furthermore, the Monitoring and Alarm Sentry ensures annunciators and alarms are always active.
 Reliable notification of system alarms in a single visual dashboard view
Audio Notification
- Separate sounds for alert status and alarm status
- Audio notification of alarms and alerts continue until the alarm state is acknowledged by an operator
Visual Notification
- Annunciator screen shows the status of the monitored point
- The alarmed point will flash in a color chosen by the user until the alarm is reset by the operator
Email Notification
- Alarming of any monitored point can automatically generate an email to notify users of the alarm
- A different email address can be entered for each monitored point
Monitoring and Alarm Sentry
- Ensures annunciators and alarms are always active, even when the annunciator screens or the Viewpoint Monitoring software is closed in error
Reliable Alarm Notification
- Create alarms on monitored digital and/or analog data points
- Configured alarm warnings delivered through Audio, Visual or Email Notification channels
Automatic Event and Waveform Retrieval
Automated archiving of event and waveform data from GE Vernova's Multilin devices ensures availability of detailed information for diagnosing power system events.
 Create comprehensive, centralized, system-wide sequence of event records for analysis of power system faults.
Event Logging
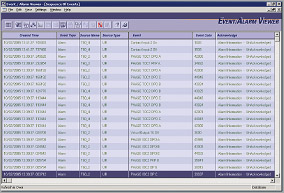
The event records from GE Vernova Multilin devices can be automatically downloaded from each device and stored in a centralized, system-wide, sequence of event record. Viewpoint Monitoring will continually poll each GE Vernova Multilin device to see if any new events have been added to that device's event record. Once a new event has been detected, the event record will be downloaded and the new events will be stored in the system-wide sequence of events record.
Event Viewing
The Event Viewer centrally stores and displays information about preset and configured systems events. Each event in the record contains the following information. This data can be sorted by any of the fields indicated below:
|
|
Waveform Archiving
The waveform (oscillography) files from GE Vernova's Multilin devices can be automatically downloaded from each device and stored on your hard drive. Similar to Event Logging, Viewpoint Monitoring will continually poll each GE Vernova Multilin device to see if any new waveform files have been created. Once a new waveform has been detected, the file will be downloaded by Viewpoint Monitoring to the centralized data repository.
Waveform Viewing
View and analyze waveform fault data that has been recorded from a power system device in a time-based, phasor quantity or tabular view. This Waveform View utility provides functionality to:
- Merge and overlay waveforms that were recorded from multiple devices
- Identify the harmonic content in the monitored parameters
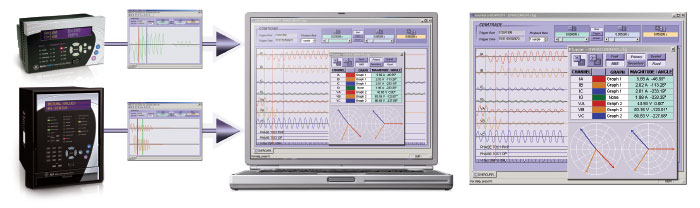 View and analyze waveform fault data retrieved from devices.
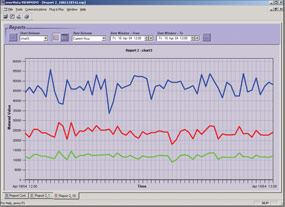 Log power level data from multiple devices at one time.
Trending Reports
Create a Historical Archive of Monitored Data from Multiple Devices
Data Logging
- Log and trend the value of monitored analog or digital points
- View logged data for a pre-configured, customized recorded time period
Records
- Create up to 100 customized records
- Store up to 50 points per record for 5000 points logged in total
Chart
- View logged data in a pre-configured, customized date range for trending analysis
Archiving Data
- Manually archive recorded data for storage onto network data repositories to reduce risk of data loss and decrease data storage requirements on local workstations
Exporting and Printing Data
- Export data into an Excel format for easy data manipulation and analysis
- Print data that is logged in trending reports
 Available remote access/monitoring
EnerVista Viewpoint Monitoring – Remote Access/Monitoring
Remote access to a EnerVista Viewpoint Monitoring instance is optionally available through EnerVista Viewpoint Monitoring ViewNodes (requires separate ViewNodes license) or Windows Server Remote Desktop Services (requires Windows Server option and Windows Remote Desktop Services (RDS) license from Microsoft).
EnerVista Viewpoint Monitoring ViewNodes
Install ViewNode client software on a remote workstation with up to 10 concurrent ViewNode clients accessing a EnerVista Viewpoint Monitoring instance.
Windows Server Remote Desktop Services
- Connect up to 5 workstations (1 admin; 4 users) to a single Viewpoint Monitoring system using Terminal Services in Microsoft Windows Server 2019/2022.
- Implement security access through user accounts with configurable permissions
- Plug-and-Play screens
- One-Line diagrams
- Annunciator panels / trending reports
- Events
- Waveforms
System Requirements
| COMPONENT | REQUIREMENT |
|---|---|
| Supported Operating Systems |
|
| Supported Databases |
|
| Computer and Processor | Recommended workstation:
|
| Memory | 4 GB of RAM (minimum) |
* Remote access requires Microsoft Windows Server Remote Desktop Services (User or Device) purchased separately
Supported Devices
|
| DEVICE DAMILY | DEVICE | FIRMWARE |
|---|---|---|
| Distribution Feeder | 3 Series 350 | 1.2x to 2.5x |
| DGCM Field RTU | 4.0x | |
| F35 | 2.6x to 8.4x | |
| F60 | 2.6x to 8.4x | |
| F650 | 1.6x to 7.7x | |
| MIF 2 | 2.40 | |
| 735/737 | 1.5x | |
| 750/760 | 3.6x to 7.4x | |
| G30 | 4.4x to 8.4x | |
| G60 | 2.6x to 8.4x | |
| 8 Series 850 | 1.1x to 2.9x | |
| Multilin Agile | 08 | |
| Generator | 489 | 1.3x to 4.03x |
| 8 Series 889 | 1.1x to 2.9x | |
| D30 | 3.0x to 8.4x | |
| D60 | 2.6x to 8.4x | |
| D90Plus | 1.8x | |
| Line Current Differential Protection | L30 | 5.6x to 8.4x |
| L60 | 2.6x to 8.4x | |
| L90 | 2.6x to 8.4x | |
| Transformer | 745 | 2.4x to 5.2x |
| T35 | 2.6x to 8.4x | |
| T60 | 2.6x to 8.4x | |
| 3 Series 345 | 1.3x to 2.5x | |
| 8 Series 845 | 1.4x to 2.9x | |
| Motor | 239 | 2.3x to 2.7x |
| 269+ | 6.0x | |
| 3 Series 339 | 1.3x to 2.5x | |
| 369 | 1.6x to 3.6x | |
| 469 | 2.5x to 5.2x | |
| 8 Series 859 | 4.0x | |
| 8 Series 869 | 1.3x to 2.9x | |
| MM200 | 1.0x to 1.2x | |
| MM300 | 1.2x to 1.70 | |
| MMII | 4.0x to 5.2x | |
| MMIII | 1.0 to 1.2x | |
| RRTD | 1.4x, 1.5x | |
| SPM | 2.0x, 2.1x | |
| M60 | 2.6x to 8.4x | |
| Network | N60 | 3.4x to 8.4x |
| Bus | B30 | 2.6x to 8.4x |
| B90 | 4.8x to 8.4x | |
| Specialized | C30 | 2.6x to 8.4x |
| C60 | 2.6x to 8.4x | |
| C90Plus | 1.6x to 1.8x | |
| U90Plus | 1.1 | |
| Miscellaneous | MRPO | 1.0 |
| FIRETRACER | 1.0 | |
| VERSAMAX | 1.0 |
* EPM1000 and EPM4000 are not available in the IED Dashboard.